...
# {*no-status title-slide} // comment
-
-
-
-
-
## Outline {#the-overview}
- Background
1. Collaboration amongst researchers
1. What are multiple affiliations
1. The why and wherefore of multiple affiliations
- Aims of this presentation
- Research landscape Japan, Germany, UK
- Data/Results
1. Trends in multiple affiliations (WoS)
1. Survey of authors
1. Multiple affiliations and research quality
- Conclusions
## Background
- Collaboration in science
- increase in co-author numbers (Adams et al. 2002; Wuchti et al. 2007)
- increased research performance (Katz and Hicks 1997; Wuchty et al. 2007)
- reasons: ease of travel/communication; concentration of resources; funders' support
(Ding et al. 2010; Freeman et al. 2014)
- Multiple affiliations {slide}
- attachment to more than one institution (public or private) {slide}
- Why and wherefore {slide}
- researchers: tap into new networks/ gain additional resources
- institutions: assessment / competition (Stephan, 2012 )
- e.g. part-time positions to attract leading foreign scholars (Xin and Normile, 2006; Bhattacharjee, Y. 2011)
- institutions/researchers: maintain links
## Aims of this presentation
- How wide-spread are multiple affiliations?
- What kinds of institutions do academics affiliate with?
- Are these affiliations beneficial for knowledge production?
- What could be the reasons for benefits?
- Looking at:
- Three countries: Japan, Germany, UK
- Four fields: Biology, Chemistry, Engineering, Economics/Business
- Bibliometric data and survey data
## Japan - Germany - UK
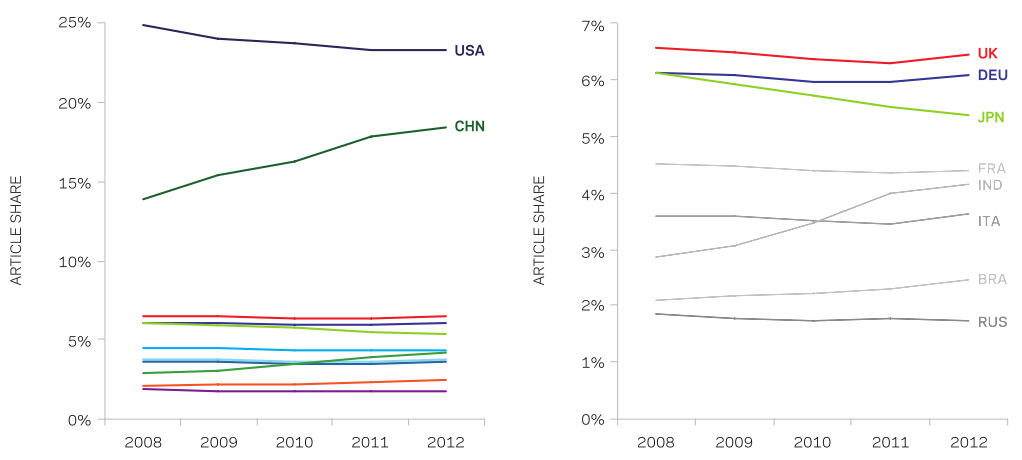 International Comparative Performance of the UK Research Base 2013, BIS/13/1297
## Trends in multiple affiliations (WoS)
- Journal publications (articles, proceedings, book chapters) from web of science
- Making use of the new author institution tag available since 2008
- Journals selected based on 2013 journal citation report
- Five journals randomly drawn from each quartile of the eigenfactor distribution for each scientific field
- Period 2008 to 2014 (citations until April 2016)
- ~ 30,000 articles, >120,000 author-publication pairs with address in Germany, Japan or UK
- Semi-manual coding of addresses
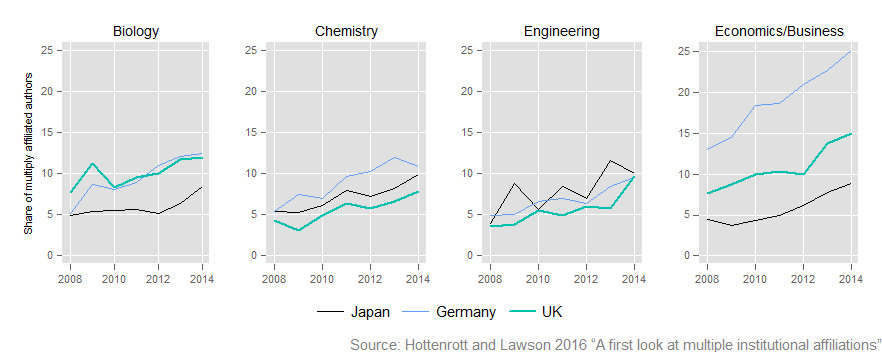
## Trends in multiple affiliations (WoS)
- Share of authors with more than one institutional address
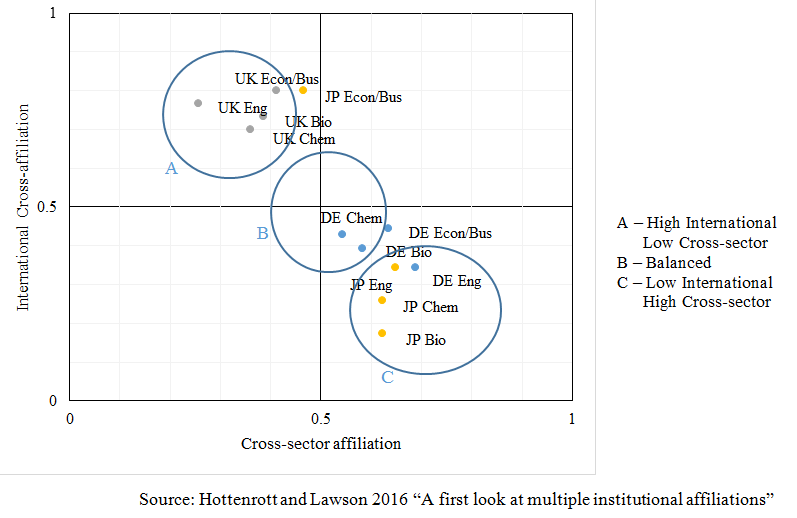
 ## Trends in multiple affiliations (WoS)
- Share of authors international and cross-sector affiliations
## Trends in multiple affiliations (WoS)
- Share of authors international and cross-sector affiliations
 ## Survey of authors
- Sample {slide}
- WoS sample - Articles published 2013-2015
- additional journals drawn for engineering and economics/business
- corresponding authors (~9000)
- Design/response {slide}
- June-August 2016, LimeSurvey web platform
- email invitations; two reminders
- 12% undeliverable (bounced) (Boselli and Galindo-Rueda, 2016; Wren et al., 2006)
- 2,260 responses (response rate: 30.5%; 36.6% Japan; 31.1% Germany; 24.5 UK)
- Questions on secondary affiliations (past and present) {slide}
## Survey of authors
- Distribution of papers by characteristics
## Survey of authors
- Sample {slide}
- WoS sample - Articles published 2013-2015
- additional journals drawn for engineering and economics/business
- corresponding authors (~9000)
- Design/response {slide}
- June-August 2016, LimeSurvey web platform
- email invitations; two reminders
- 12% undeliverable (bounced) (Boselli and Galindo-Rueda, 2016; Wren et al., 2006)
- 2,260 responses (response rate: 30.5%; 36.6% Japan; 31.1% Germany; 24.5 UK)
- Questions on secondary affiliations (past and present) {slide}
## Survey of authors
- Distribution of papers by characteristics
|
| Papers
2008-2004
| Surveyed sample
2013-2015
| Respondents' Papers
2013-2015
|
| Journal Impact | | | |
| Quadrant 1 | 41.87 | 45.25 | 42.88 |
| Quadrant 2 | 19.15 | 20.53 | 20.18 |
| Quadrant 3 | 26.74 | 21.41 | 22.96 |
| Quadrant 4 | 12.24 | 12.81 | 13.98 |
| Paper impact | | | |
| 99pct | 2.27 | 3.75 | 3.27 |
| 90pct | 16.49 | 22.70 | 20.27 |
| Authorship | | | |
| single authored | 7.93 | 6.90 | 8.31 |
| international link | | 29.35 | 27.64 |
| Discipline | | | |
| biology | 38.11 | 27.43 | 26.24 |
| chemistry | 34.90 | 27.56 | 29.38 |
| engineering | 15.16 | 21.36 | 21.37 |
| econ/bus | 11.83 | 23.65 | 23.01 |
## Survey of authors
- Share of authors with multiple affiliations
- @svg: maffil2.svg 800 200
- Notes {slide}
- Publication data underestimates multiple affiliations
- only 27% of authors report all affiliations
- share higher amongst those we identified on publications
- Survey data shows higher levels of cross-sector affiliations also for UK researchers
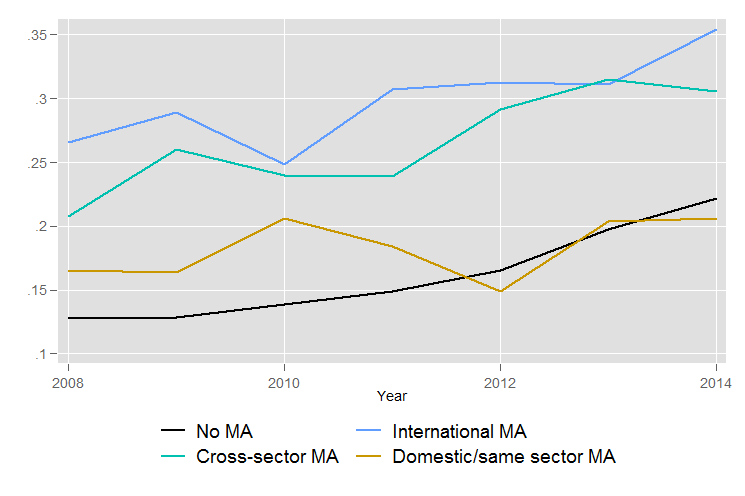
## MA and research quality (WoS)
- Share of Top 10% cited publications by MA status
 ## MA and research quality (WoS)
| Dependent: Top 10% cited; Papers 2008-2014
|
| Reference: Germany | | | | |
| Japan | -0.105*** | (0.018) | -0.105*** | (0.018) |
| UK | 0.017** | (0.007) | 0.017** | (0.007) |
| Reference: Engineering | | | | |
| Bioscience | 0.073 | (0.059) | 0.073 | (0.059) |
| Chemistry | 0.093** | (0.041) | 0.093** | (0.041) |
| Econ/Bus | 0.195*** | (0.051) | 0.194*** | (0.051) |
| Within-sector MA | 0.024*** | (0.009) | | |
| Cross-sector MA | 0.051*** | (0.012) | | |
| Domestic MA | | | 0.040*** | (0.012) |
| International MA | | | 0.043*** | (0.010) |
| Reference: Journal Quality Quadrant 1 | | | | |
| Quadrant 2 | -0.138*** | (0.050) | -0.137*** | (0.050) |
| Quadrant 3 | -0.217*** | (0.055) | -0.217*** | (0.055) |
| Quadrant 4 | -0.206*** | (0.054) | -0.206*** | (0.054) |
| Author count | 0.009*** | (0.003) | 0.009*** | (0.003) |
| Funding acknowledgement | 0.081*** | (0.021) | 0.080*** | (0.021) |
| N | 125014 | | 125014 | |
| N_cluster (journal) | 103 | | 103 | |
| ll | -45403.638 | | -45402.913 | |
| Note: * (**, ***) indicate significance levels of 1% (5%, 10%), Clustered, robust standard errors in parentheses; model includes year fixed effects |
- @anim: %+class:bg-1: #cell2
- @anim: %+class:bg-2: #cell1
- @anim: %+class:bg-3: #cell3, #cell4
## MA and research quality (WoS)
|
Top 10% paper |
Top 1% paper |
Citation count |
|---|
| Within-sector MA | 0.024*** | (0.009) | 0.002 | (0.004) | 0.086*** | (0.032) |
| Univ. X Industry | 0.036*** | (0.013) | -0.012* | (0.007) | 0.166*** | (0.051) |
| Univ. X PRO / NGO | 0.056*** | (0.014) | 0.013* | (0.007) | 0.198*** | (0.057) |
| Univ. X other | -0.000 | (0.021) | 0.003 | (0.009) | -0.005 | (0.083) |
| Domestic MA | 0.040*** | (0.012) | 0.008 | (0.005) | 0.141*** | (0.039) |
| International MA | 0.043*** | (0.010) | 0.008 | (0.005) | 0.151*** | (0.041) |
|
Japan |
Germany |
UK |
|---|
| Within-sector MA | 0.025*** | (0.009) | 0.018* | (0.010) | 0.024 | (0.023) |
| Univ. X Industry | 0.034** | (0.014) | 0.054* | (0.028) | 0.010 | (0.039) |
| Univ. X PRO / NGO | 0.052*** | (0.016) | 0.052*** | (0.013) | 0.018 | (0.025) |
| Univ. X other | 0.018 | (0.024) | -0.013 | (0.039) | 0.005 | (0.034) |
| Domestic MA | 0.038*** | (0.013) | 0.035** | (0.014) | 0.010 | (0.022) |
| International MA | 0.061*** | (0.011) | 0.042** | (0.017) | 0.026 | (0.022) |
|
Bioscience |
Engineering |
Econ/Bus |
|---|
| Within-sector MA | 0.009 | (0.012) | 0.039 | (0.026) | 0.044* | (0.024) |
| Univ. X Industry | 0.038 | (0.031) | 0.069** | (0.032) | -0.015 | (0.064) |
| Univ. X PRO / NGO | 0.070*** | (0.021) | -0.014 | (0.015) | 0.001 | (0.034) |
| Univ. X other | 0.005 | (0.047) | 0.080*** | (0.031) | 0.027 | (0.042) |
| Domestic MA | 0.049*** | (0.017) | -0.012 | (0.021) | 0.061* | (0.034) |
| International MA | 0.041** | (0.017) | 0.047** | (0.023) | 0.009 | (0.024) |
- @anim: %+class:bg-2: #cell2, #cell1
- @anim: %-class:bg-2: #cell2, #cell1
- @anim: %+class:bg-3: #cell3, #cell4
- @anim: %+class:bg-4: #cell5
## MA and research quality (Survey)
| Dependent: Top 10% cited; Survey Respondents
|
| Reference: Germany | | | | |
| Japan | -0.107*** | (0.027) | -0.103*** | (0.027) |
| UK | 0.031 | (0.021) | 0.03 | (0.021) |
| Reference: Engineering | | | | |
| Bioscience | 0.048 | (0.064) | 0.049 | (0.064) |
| Chemistry | 0.026 | (0.043) | 0.026 | (0.043) |
| Econ/Bus | 0.095** | (0.040) | 0.091** | (0.040) |
| Within-sector MA | -0.009 | (0.035) | | |
| Cross-sector MA | 0.037* | (0.019) | | |
| Domestic MA | | | 0.007 | (0.026) |
| International MA | | | 0.054** | (0.026) |
| Reference: Journal Quality Quadrant 1 | | | | |
| Quadrant 2 | -0.100** | (0.046) | -0.102** | (0.045) |
| Quadrant 3 | -0.172*** | (0.049) | -0.172*** | (0.049) |
| Quadrant 4 | -0.160*** | (0.047) | -0.161*** | (0.046) |
| Author count | 0.011*** | (0.004) | 0.011*** | (0.004) |
| N | 2106 | | 2106 | |
| N_cluster (journal) | 141 | | 141 | |
| ll | -950.213 | | -949.492 | |
| Note: * (**, ***) indicate significance levels of 1% (5%, 10%), Clustered, robust standard errors in parentheses; model includes year fixed effects |
- @anim: %+class:bg-2: #cell1
- @anim: %+class:bg-4: #cell2
## Why and Wherefore? - Survey Evidence
|
| Domestic/single-sector MA
| International MA
| Cross-sector MA
|
| Prestige | 50.0 | 67.0 | 57.4 |
| Network building | 68.4 | 81.9 | 80.7 |
| Knowledge Exchange | 63.3 | 74.5 | 79.7 |
| Teaching experience | 38.8 | 21.3 | 30.7 |
| Access to students | 25.5 | 29.8 | 30.7 |
| Student job opportunities | 30.6 | 41.5 | 44.1 |
| Funding | 31.6 | 40.4 | 42.1 |
| Data, materials, etc. | 38.8 | 50.0 | 46.0 |
| Lab, equipment | 39.8 | 22.3 | 36.6 |
| Personal income | 24.5 | 26.6 | 24.8 |
| Own job prospects | 34.7 | 37.2 | 40.1 |
| Other | 11.2 | 9.6 | 8.9 |
- @anim: %+class:bg-2: #row2
- @anim: %+class:bg-4: #row3
## Why and Wherefore? - Survey Evidence
| Dependent: Top 20% cited; Survey Respondents
|
| Cross-sector MA | 0.009 | (0.025) |
| International MA | -0.009 | (0.038) |
| Motivations | | |
| Prestige | -0.014 | (0.041) |
| Network building | 0.114*** | (0.038) |
| Knowledge Exchange | 0.023 | (0.046) |
| Teaching experience | -0.027 | (0.045) |
| Access to students | -0.076 | (0.050) |
| Student job opportunities | 0.036 | (0.044) |
| Funding | 0.067 | (0.044) |
| Data, materials, etc. | 0.003 | (0.040) |
| Lab, equipment | -0.015 | (0.036) |
| Personal income | 0.051 | (0.040) |
| Own job prospects | -0.019 | (0.033) |
| Other | 0.025 | (0.048) |
| | |
| N | 668 | |
| N_cluster (journal) | 123 | |
| ll | -377.588 | |
| Note: * (**, ***) indicate significance levels of 1% (5%, 10%), Clustered, robust standard errors in parentheses; model includes all control variables |
- @anim: %+class:bg-2: #row2
## Summary
- Trends in MA
- Publications
- Multiple affiliations have increased in all fields and countries
- Cross-sector affiliations higher for Germany and Japan, reflective of the stronger public research sectors in both countries
- Cross-country affiliations are highest for the UK (UK attractive as international partner / more international researchers)
- Survey
- shows that publications are imperfect measure for MA but confirm some of the observations
- MA and research quality
- MA authors more likely to publish high impact articles, especially:
- international MA and cross sector with public research organisations
- But: no effect for UK authors (no additional benefits from affiliations?)
- Engagement motivations have weak effect on publication impact
- Network motive most important
- Country and subject differences
## Conclusions / Future Work
- Access to networks raises publication quality?
- Why Multiple Affiliations? Is Co-authoship not enough if goal is to overcome knowledge burden?
- Does prestige of organisaton or what they offer not matter?
- Initial higher citations - but what about the long run? Do we measure visibility effect instead of quality?
- Network effect maintained if we look at impact factor instead of publications
- Is Institutions' push for MA the real driver?
- Only MA arrising from prior employment associated with top publications - MA as mean to preserve networks?
- Questions arising from this research {slide}
- Authors do not report all affiliations. Selection based on journal, funder, coauthors, etc?
- Causality? Longitudinal study of MA and publication performance
- Multiple affiliations due to precarious work situation (70% of junior researchers)
# Thank You! {title-slide}
- c.lawson@cbr.cam.ac.uk
- http://science-careers.wi.tum.de/science-survey.html
/ − automatically replaced by the author − automatically replaced by the title